Penetration
To calculate penetration, fill in the registries of regions and real estate and specify Number of residential premises.
The penetration rate for the widget is calculated as follows: the number of active customers in each region divided by the total number of residential premises in this region. Customers are selected by matching the region in the street address of their basic subjects with the region of the real estate. The number of active customers is calculated by the same algorithm as for the widget Active customers. The number of residential premises for each month is determined at the date of the last calculation of penetration rates.
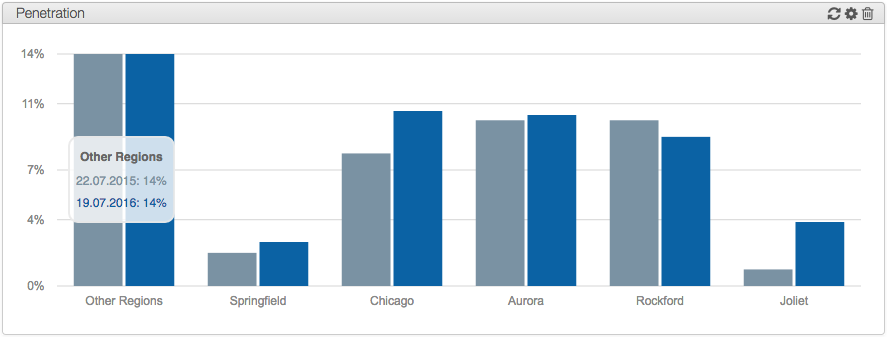
The penetration rate is calculated for regions from the next level of the hierarchy in relation to the company’s region. For example, the screenshot below shows the figures by cities, since in the registry of regions cities are stated as subregions in relation to the state Illinois, which is specified as the company home region.
In the penetration graph there are two indicators: one for the beginning of the period and the other for the end of the period. In this example, bars for July 2012 and June 2013 are shown, at the date of July 18, 2013 and the period of interest of twelve months. Figures for the first five regions with the highest penetration percentages are shown separately. Figures in Other regions are calculated by taking the total number of customers in the remaining regions and dividing it by the total number of residential dwellings in these regions.