Reports on Services Usage
In this section
Reports of this type are used for viewing data on services provided to customers. They are created on the basis of charge log contents. Hydra Billing report builder allows grouping the data according to product catalog entries (including price plans), customers and their accounts, groups of customers, and many other criteria.
Such reports are used mostly for:
-
analyzing statistics on price plans usage by customers,
-
temporal trends in the numbers of customers per various price plans, or
-
analyzing price plans profitability.
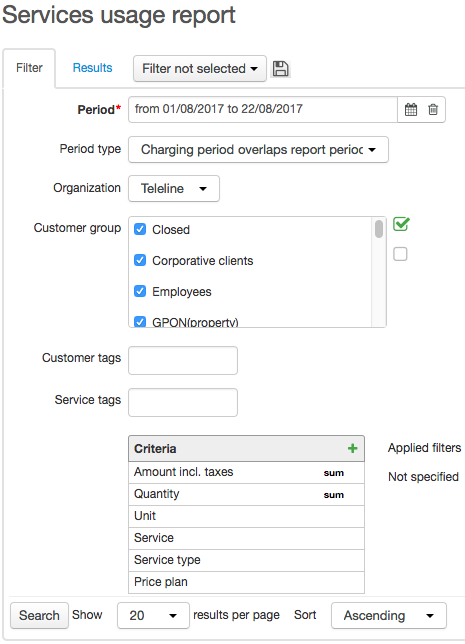
In addition to the box for entering a certain report period, the Filter tab contains Period type. Depending on the type entered in it, certain charge log rows are used to provide information for a report (for scheduled services, each charge log row stands for one charging period, whereas for one-off services it stands for the duration of a provided service, and for traffic services it stands for one session).
-
Start date falls within report period — when chosen, the report contains only the data from such rows of charge logs that have start dates within the period the report is created for:

-
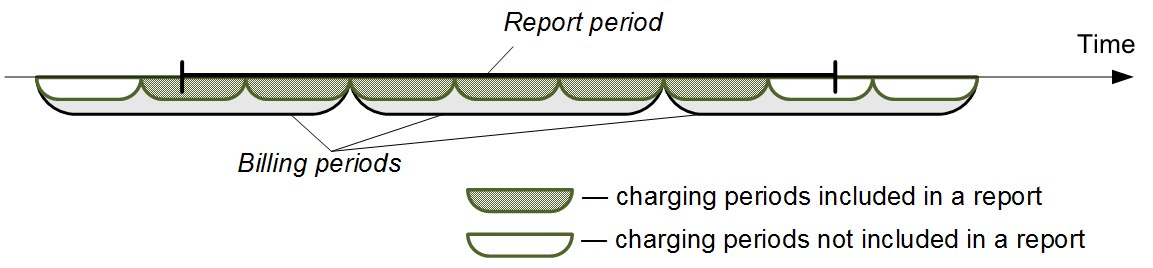
End date falls within report period — when chosen, the report contains only the data from such rows of charge logs that have end dates within the period the report is created for:
-
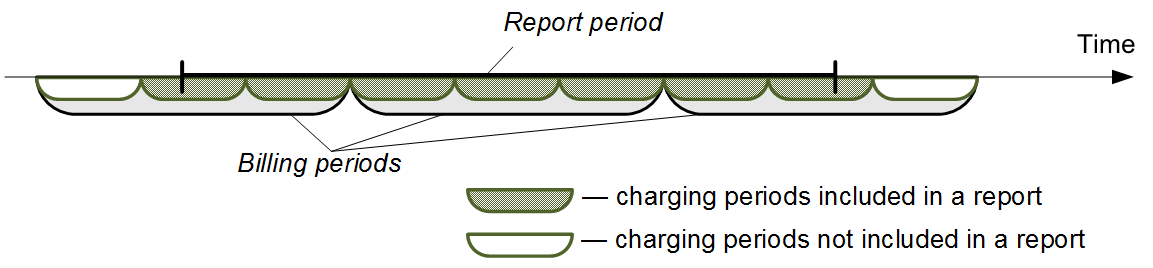
Charging period overlaps report period — when chosen, the report contains the data from rows with start or end dates falling within the report period:
-
Charging date falls within report period — rows are added to the report if their charging dates fall within the report period: if charging is carried out at the beginning of the period, then rows to be included into report are the same as for the Start date falls within report period type; if charging is carried out at the end of the period, then rows to be included into report are the same as for the End date falls within report period type.
In Organization, enter the organization that provides services or goods.
Statistics on Price Plans Usage by Customers
To view the number of customers using services in terms of certain price plans, follow these steps. Choose the period for creating a report, add two criteria — Price plan and Customer. Apply the COUNT DISTINCT function to the Customer criterion. In Period type choose, for example, Charging date falls within report period.
After clicking Search the following report is created.
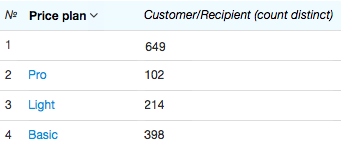
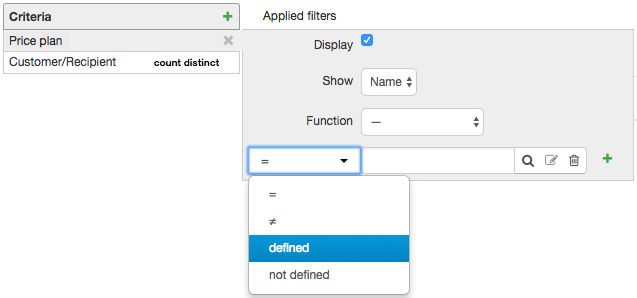
The second column of the table shows the number of customers who have been charged for services provided within price plans over the report period. There is a row with no value in the Price plan column, which means 3 customers have been provided services outside any price plan (this number includes the customers using price plans that contain no services in them). In order to leave these details out of the report you should apply the defined filter to the Price plan criterion.
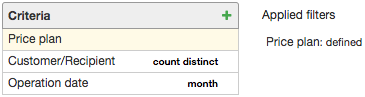
To analyze trends in customer usage per various price plans over a certain period, add the Operation date criterion, and specify the necessary unit in its settings, for example, a month.
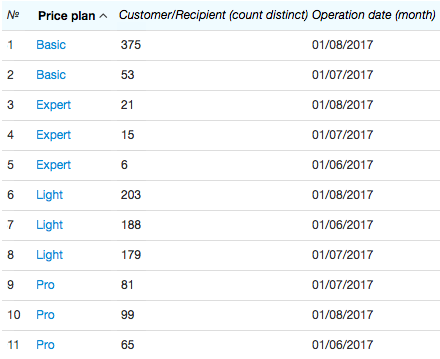
The table shows the number of customers per each month that consumed services within the corresponding price plans.
Certain customers are not included in the abovementioned report. It happens when there are charge logs issued for them according to some price plan, but no services have actually been consumed within it (i.e. no child rows are present in such charge logs).
To determine the total number of customers using certain price plans you should use the Customer, Service, and Service type criteria when creating a report.
Apply the COUNT DISTINCT function to the Customer criterion together with the condition to be equal to Price plans to the Service type criterion.
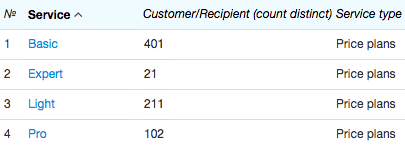
You can see that there are 401 customers subscribed to the Basic price plan, but according to the report above 398 of them use services within this plan.
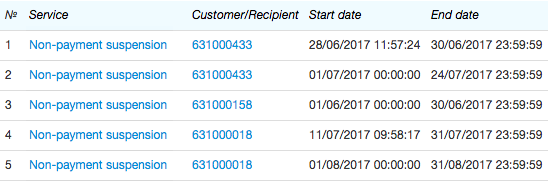
There is another way to utilize reports on goods and services, such as to search for customers who use a certain service. For example, to search for all customers suspended at the moment, you should choose Current date in Period, and Service period overlaps report period in Period type. Add such criteria as Service and Customer. Make the Service criterion equal to the suspension service.
Quantity of Services Consumed by Customers
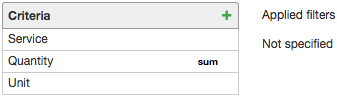
In the example below, let us create a report to check the amounts of services customers consumed in the previous month. Specify the month in Period on the Filter tab, and choose Service period overlaps report period in Period type. Add such criteria as Quantity, Unit, and Service to the Criteria table. Apply the SUM function to the Quantity criterion.
The following report is created.
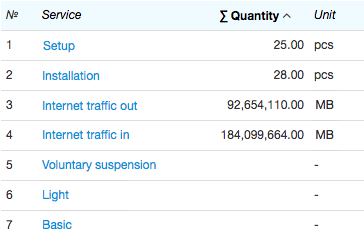
Price plans are considered just like services, so they are also included in the report. However, they have no units, and the Quantity and Unit columns are empty.
To create a report containing data on separate services (for example, to check the number of installations), you should add the Service type criterion and add the condition to be equal to Services.
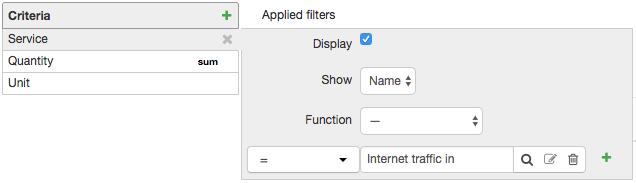
Let us suppose that you need to view the quantity of a particular service consumed, for example, of the inbound traffic. In this case, you should apply an additional filter to the Service criterion, that is to be equal to the corresponding service in the product catalog (Internet traffic in). The result table is created with only one row.
To view the consumed traffic by price plans you should add the Price plan criterion. Thus, the total quantity of the consumed service would be calculated per each price plan separately:
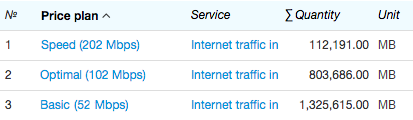
Moreover, you can view the changes that occurred in the course of a month in the amount of the inbound traffic consumed within the Optimal price plan. Apply the condition for the Price plan criterion to be equal to Optimal. Add the Operation date criterion, and in its settings choose Week in Unit. Now the quantity of the service is determined per each week of the month.
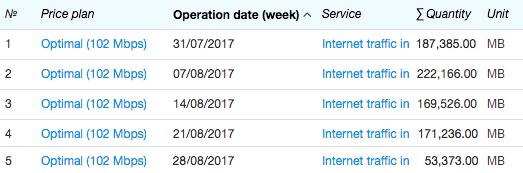
In the example above, in the first row you can see the amount of the inbound Internet traffic consumed from August 1 to August 6, and in the last row — that from August 28 to August 31.
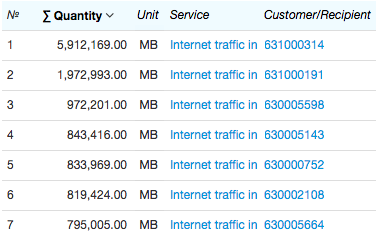
By using the Customer criterion you can search for customers with largest amount of inbound Internet traffic consumed over the current month. To do so, add the Service, Quantity, Unit and Customer criteria. Make the Service criterion equal to a corresponding service, and apply the SUM function to the Quantity criterion. In the created report, sort out the results by the Quantity column.
The Total Cost of Provided Services
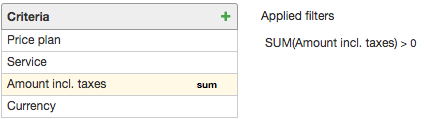
You can determine the amount the services have been provided for, in terms of a certain price plans. Add the following criteria to your report: Price plan, Service, Currency, Amount incl. taxes. Apply the SUM function to the Amount incl. taxes criterion, and also set the condition to be > 0 in order to avoid including free services.
The table shows the total cost of services provided over the report period.
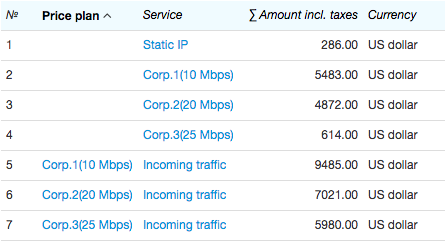
Rows with no values in the Price plan column correspond with the cost of services provided outside any price plans (row 1), and also with the customer fee for the price plans excluding the cost of services within these price plans (in the latter case, the Service column shows the name of the price plan, rows 2–4). To exclude such rows from the report, apply the Defined filter to the Price plan criterion. Or, if you apply the Not defined filter, the final table would include only the costs of price plans and services provided outside price plans.
Rows 5–7 show the cost of services included in corresponding price plans, and they do not contain any customer fee for such plans.
If you want to determine only the customer fee for price plans, use the Service type criterion instead of Price plan applying the condition for it to be equal to Price plans.
When necessary, you can create a table containing data only on several particular services or price plans by applying additional filters to corresponding criteria.
To see not only costs but also the quantity of services, add the Quantity (and apply the SUM function to it) and Unit criteria.